• Happier Air monitor gif showing device placed on refridgerator

    Stick him anywhere magnets go

  • Happier Air monitor gif showing device go from happy to sad when air is bad

    Works out of the box, no app setup required

  • Happier Air monitor gif showing device get happy when exposed to clean air

    Turns 😊 again when air is good

1 of 3
  • Happier Air monitor showing dashboard with air quality measurements

    Dashboard for all

    View all 9 real time measurements on 1 screen, no need for WiFi or app

  • Happier Air monitor displaying historical air quality data

    History

    Track how much good, happier air you breath over time

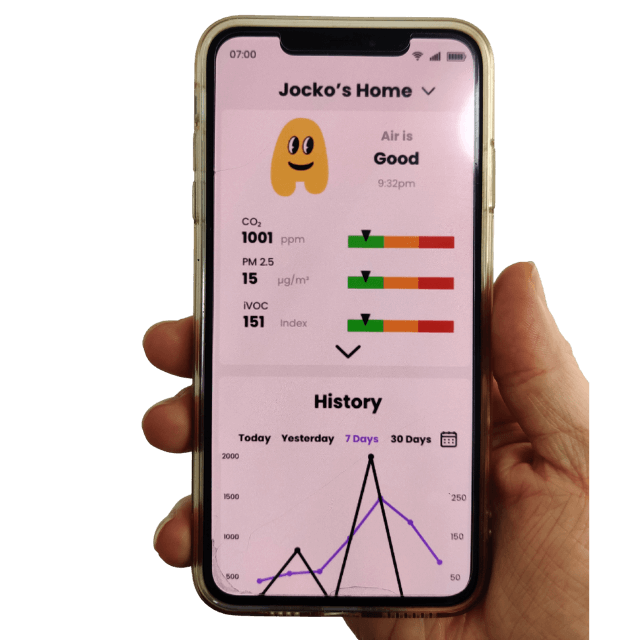
  • Smartphone app interface for Happier Air monitor

    Track in app

    Log air during activities like sleep to see impact on health & performance

  • 🦠CO2

    What? A proxy for 2nd hand air

    AKA Stale Air

    Why? Best measure for COVID in the air, often cause of "brain fog"

  • 🚬PM2.5

    What? Small particulate matter

    AKA Pollution

    Why? Lowers brain function, increase age-related disease

  • 🧪tVOC

    What? Total Volatile Organic Compounds

    AKA Chemicals in the air

    Why? Some (ie: cleaning products) can cause illness, lowered performance

  • 🍄 Mold Risk

    What? Algorithm to estimate the likelihood that mold will grow in your room, based on current observed conditions.

    Why? Mold and mycotoxin exposure can cause many health problems

  • 🎨Formaldehyde

    What? A chemical often in home products & paint
    AKA FMD

    Why? Can cause respiratory issues and is a potential carcinogen

  • 🏭PM 1

    What? Particulate matter smaller than 1 micrometer
    AKA Very Small Pollution
    Why? Can penetrate deep into lungs, causing heart/lung issues

  • 🏭🏭PM10

    What? Particulate matter 10 micrometers or smaller
    AKA Slightly Bigger Pollution

    Why? Big globs of pollution that harm breathing

  • 🌡️Temperature

    You Know This One
    What? Measure of how hot or cold the air is
    Why? Impacts comfort and some pollutants' behavior

  • 💧Relative humidity

    What? Amount of water vapor in the air
    AKA Moisture
    Why? Too high or low can enable pollutants & microbes (ie: mold)

1 of 9
feature-item-1
It can make you stupid
Trust us but want to verify? Check the data👇

Research

Brain scores worse with over 1,000 ppm CO2 + VOCs versus green building air (Allen 2016)

GDP goes down 0.8 percent for every 1 microgram increase of PM2.5 pieces per cubic meter of air (OECD, 2019)

  • A 2019 OECD article using satellite data of Europe found that just a 1 μg/m3 rise in PM2.5 pieces per cubic meter causes 0.8% lower GDP that year.
  • 95% of that GDP drop is because workers make less stuff. That happens from workers being out sick more or working slower in bad air.

Politicians’ talks are 2.3 percent less complex on days with over 15 μg/m3 PM2.5 air (Heyes, 2019)

Elderly ladies’ thinking aged 2 years faster for every 10 micrograms more PM2.5+PM10 pieces long-term in a cubic meter (Weuve, 2013)

Chess errors go up 1.5 percent for every 10 microgram increase of PM2.5 pieces in each cubic meter of air (Künn, 2019)

Chess mistakes under time pressure go up 3.2 percent for every 10 microgram increase of PM2.5 per cubic meter (Künn, 2019)

Dementia chance goes up 16 percent from breathing years of PM2.5 pieces over safe levels (Fu, 2019)

Parkinson’s disease chance is 34 percent higher after years of too-high PM2.5 air (Fu, 2019)

  • A study found that when CO pollution goes up 1 ppm over 3 hours, umpires make 11.5% more bad calls.
  • Also, when 24-hour PM2.5 pollution rises 10 micrograms per cubic meter, umps make 2.6% more mistakes.
  • The study was good at telling if it was CO or PM2.5 fumes causing worse work by the umps (Archsmith, 2018).

Read the full Ultimate Guide to Air and Brain Health

Dimensions

Specifications

Dimensions

91.7 x 61.3 x 31.9mm

Weight

135g

Air Sensors

  • CO2: NDIR sensor (Non-dispersive infrared), range 0-5000 ppm, ±30 ppm ±3% accuracy
  • Particulate Matter (PM2.5, PM10, PM1): Laser scattering optical particle counter, particle size detection 300 nm to 10 μm, range 0-200 μg/m3
  • Volatile organic compounds (VOCs) advanced semiconductor sensor
  • Temperature 15–35 °C (59–95 °F) and relative
    humidity 0–80 %

Sensors are sourced directly from accredited, leading manufacturers, and undergo rigorous testing to ensure exceptional standards of accuracy, reliability, and performance that meet or exceed industry benchmarks for consumer-grade air quality monitoring devices.

Epaper Display

71 x 53mm epaper screen with glass display

Color

Classic emoji yellow

Materials

High-grade ABS, built for strength and impact resistance

Battery Life and Charging

Rechargeable 3000 mAh lithium battery, up to 2 week battery life on a single charge (varies based on settings; 24 hr battery life for all sensors on with 10 min refresh rate)

Charging

USB-C charging port, supports up to 2.5A input.

Connectivity

WiFi and Bluetooth

Notification Sound

Physical switch to toggle between silent and voice notification modes

Wall Mounting

Magnetic back for mounting on metal surfaces. Comes with wall-mountable plate.

Compute

Powerful microcontroller and embed storage on-board; supports over-the-air updates to get smarter over time

User Input

Up / Down, OK and MUTE buttons located on right-hand side and top of device

Functionalities

Real-time air quality monitoring

High accuracy sensor data reported on device and mobile app. Sensors use auto-calibration.

Measures carbon dioxide (CO2) concentration, PM2.5, PM1, PM10, tVOC, Formaldehyde Index, Mold Risk, temperature and relative humidity.

Smiley Face Air Indicator

The face changes to show how clean or dirty the air is:

  • Good air: 😊
  • So-so air: 😐 
  • Bad air: 🙁

The smiley face changes from happy to sad when CO2, tiny dust (PM2.5), or air chemicals (tVOC) get too high.

This makes it easy to see air quality at a glance, without needing to read numbers, see scary red alerts, or understand complicated charts.

Smiley Indicator Thresholds

Out of the box thresholds:

CO2: 

  • Good air: 😊 <800 ppm
  • Moderate air: 😐 ≥800 and <1000 ppm  
  • Unhealthy air: 🙁 ≥1000 ppm

PM2.5:

  • Good air: 😊 <12 μg/m3
  • Moderate air: 😐 ≥12 and <35 μg/m3
  • Unhealthy air: 🙁 ≥35 μg/m3

tVOC:

  • Good: 😊  < 50 ppb
  • So-so: 😐 50-250 ppb
  • Bad: 🙁 250 ppb

Customize Sensor Settings

Enable or disable CO2, PM2.5, and VOC sensors based on your preferences.

This allows you to extend battery life, receive data and notifications only for the measurements you prioritize.

Refresh Rate Settings

Customize how often your screen and air data updates.

Each refresh updates screen display & samples the air.

  • Choose intervals of 1, 10, or 30 minutes
  • Each refresh updates display and samples air
  • Adjust in device menu or companion app
  • Less frequent updates extend battery life

Changeable Display Screens

Press up or down buttons on device to see different screens including:

  • Big Smiley: Just the face
  • All Numbers: See all 9 air measurements right now
  • History: Check how air quality changed over time

On Device Data

  • Dashboard: Real-time display of 9 air quality measurements
  • Air History: Shows air quality ratings (good, so-so, bad) for the current tracked time period
  • Custom Timer: Use device Timer to track Air History. Reset timer and customize sensor selection (e.g., track only CO2 while you sleep)
  • Track up to 7 days on the Timer
  • Offline Functionality: Works independently without internet, phone, or app
  • Easy to use: Works out of the box

Companion App

  • Personalized Insights:
  • Closed feedback loop: Insights based on your tracked activities and personal air data
  • Tag and record air quality for specific activities (e.g., sleep)
  • Receive scientifically proven insights on air quality's impact on your performance and health

Easy Setup:
• Pair device in under 2 minutes
• Simple out-of-the-box instructions

  • Comprehensive Data Access:
  • View current and historical air quality measurements
  • Native iOS and Android apps

  • Advanced Analytics:
  • Chart views for visual data representation
  • Data export functionality
  • Detailed analysis and long-term trend tracking

  • Multi-Device Management
  • Secure Connectivity

Notification Sound

Notification audibly tells you when air quality exceeds unhealthy (🙁) threshold for any air quality measurement.

Mute switch disables audible alert so you never hear it.

Portable

  • Fits in your pocket
  • Built in lanyard loop to hang on things like car rear-view mirrors 
  • Shows air quality with simple face emojis to easily share with others
  • Rechargeable battery life easy for traveling

Home use

Supports wall mounting or table top placement.

Magnetic back allows for attachment in many home, classroom and work environment locations (like white boards and refrigerators).